We’re continually updating our platform to stay ahead of the curve and make important improvements. Check back here for our updates and to keep up with our latest innovations.
See the latest updates to the SocialClimb platform!
Improvements 5/18/22
Upload Google Call Details—When Google Ads campaigns are created, we add call tracking numbers that are used for location extensions, which are found at the bottom of a Google Ad:

Since location extensions are shared across ad campaigns, we weren’t able to attribute calls from location extensions to the actual campaign that drove the call. While ensuring that we captured data on more calls, the reports could be unclear and cause some confusion around whether or not campaigns were performing well.
To improve clarity, we’ve integrated with additional Google call data to tie these calls to the correct campaign. We also gain info about calls we may not have previously captured due to instances where our call tracking numbers were not applied correctly. This will help provide greater understanding around campaign performance, which will in turn reinforce the value being provided by the campaigns.
Google Ads API Updates—Google is sunsetting the old Google Ads API so we’ve updated to the new API in order to prevent any interruptions to our customers using Google Ads.
Twilio Data : Schema Update—We’ve updated the way we structure call tracking data to improve the way we report on what happens when an account uses call tracking numbers.
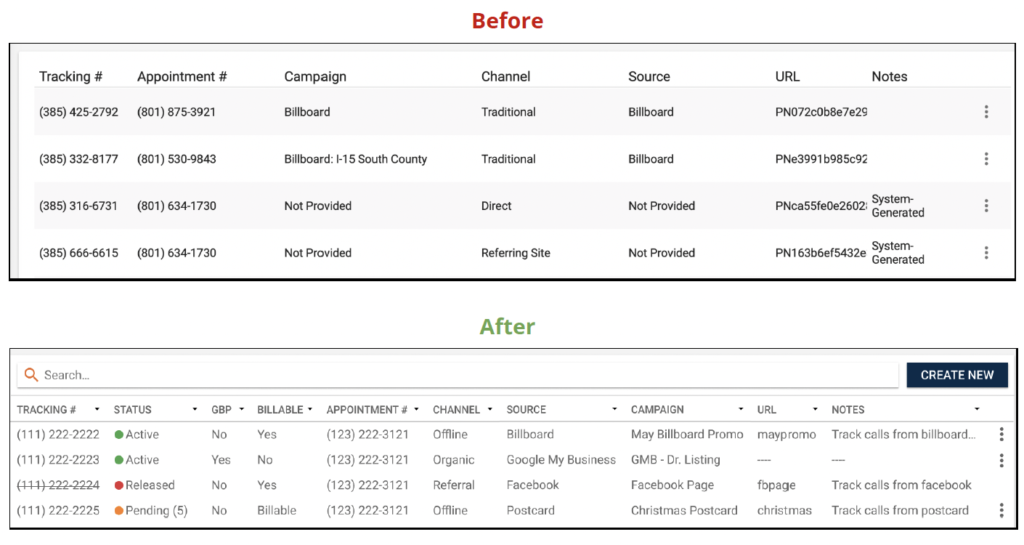
Call Tracking Number Management—The Call Tracking Numbers page found in the Settings section of the platform has been updated. The purpose of this page is to manage call tracking numbers from start to finish, so we’ve added a Create New button next to the search bar. New columns have been added and some have been reordered to improve clarity around the hierarchy of reporting on call trackers.
 New Columns
- Status—Indicates the status of a call tracking number.
- Active—The number is able to receive calls, and any calls received will be forwarded to the number in the Appointment # column.
- Pending—The number has been released, but is still within the timeframe to reclaim (60 days total). Displayed to the right of the status are the number of days left to reclaim the number. During the 60-day period, calls will continue to be forwarded to the number in the Appointment # column.
- Released—The number is released. Calls will not be forwarded and the number can no longer be recovered.
- GBP—Indicates whether the call tracker is associated with a Google Business Profile.
- Billable (Only visible to the SocialClimb team)—Indicates whether the call tracker and associated minutes are billable or not.
The Triple Dot Menu
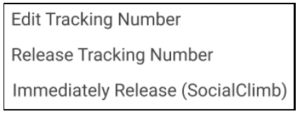
The triple dot menu to the far right of each call tracking number provides different options depending on the status of the call tracking number.
- Active Status
-
- Edit Tracking Number—When selected, this option opens the Edit Campaign modal of the call tracking campaign.
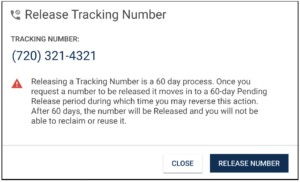
- Release Tracking Number—When selected, this option displays the following modal. Clicking Release Number closes the modal and updates status to Pending.
-
- Immediately Release (SocialClimb)—This option is only visible to SocialClimb employees. Instead of putting the number into the 60 day flow, it should immediately release the number with Twilio. We should still show it in a Pending state for the 10 days we can recover the number with Twilio, then move to Released.)
- Pending Status
-
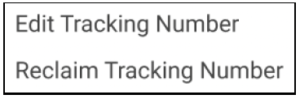
- Edit Tracking Number—When selected, this option opens the Edit Campaign modal of the call tracking campaign.
- Reclaim Tracking Number
- If selected within the first 60 days of being released, the status is changed to Active and the countdown is removed.
- Note: If the number is again released and moves to the Pending status, the 60 day countdown starts over instead of picking up where it previously left off.
- If selected within the first 60 days of being released, the status is changed to Active and the countdown is removed.
- Released Status
- Once a number’s status has been changed to Released, the triple dot menu is no longer available.
Add the Ability to Delete Boost Playbooks—In order to keep the list of playbooks as relevant and concise as possible, users can now delete Boost playbooks from their instance of the platform. From the Playbooks page in Boost, users can select the “Delete” option from the triple dot menu of a playbook.
- If a playbook has been deleted, it will no longer be displayed in the wizard when creating a Boost campaign.
- If a playbook is currently being used in a campaign, the campaign will be unaffected and the playbook will continue to show on the Campaign Edit screen of Boost:
SocialClimb Infrastructure Updates—With this update, we’ve made improvements to the infrastructure used to build and maintain the platform. These improvements make it easier for our engineers to make updates and ensure smooth running of the application.
Improvements 4/28/22
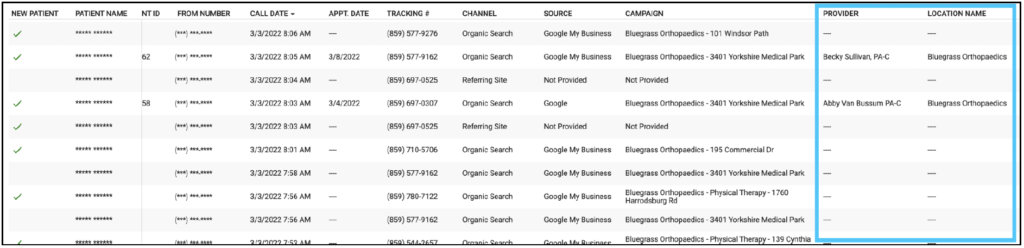
Add Provider and Location to the Call Report—We’ve added columns to the call report that display both the location and provider patients are scheduled with. This provides our customers with more insight into the impact a campaign is having on specific providers and locations.
Call Report Download Option—You can now download the call report as a CSV from the triple dot menu. This is another great way we can provide you with the ability to manipulate this data in any way you wish.
Download Boost Report CSV—You now have the ability to download the Boost report as a CSV, which provides you with more capability to manipulate that data however you wish.
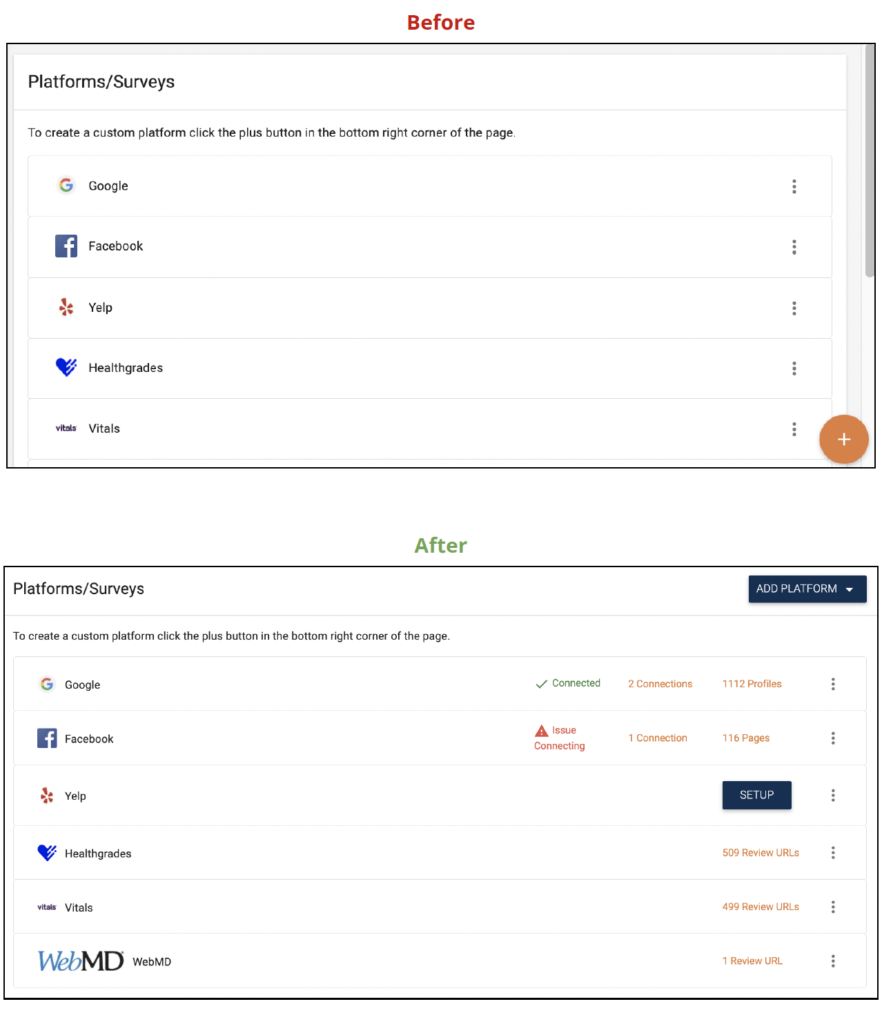
Platform Page – Visibility Enhancements—To provide you with a better experience and more clarity regarding the state of platforms while managing them, we have made some adjustments to the Platforms page. You no longer have to click into each platform connection in order to see information about the connections or to determine which actions to take when establishing a connection.
Displaying Information For API Platforms
If a connection has not yet been established, a blue Setup button is displayed. Once a connection has been established, some information about the connection is displayed. With platforms where you are authenticated in (Google/Facebook), the following is displayed:
- The state of the authentications—Do we still have access? Has an auth expired? If we are still able to actively sync, this should be marked as Connected. If any auths need to re-authenticate, this will be marked as Issue Connecting.
- The number of connections—How many connections do we have to sync the data in?
- The number of synced objects—How many things are we syncing? In the case of Google, this is the number of Profiles. For Facebook, it’s the number of pages.
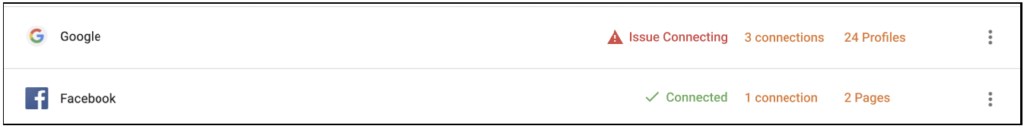
The triple dot options for these platforms are as follows:
- Manage Sync Connections
- Manage Review URLs
- Refresh Data
Displaying Information For Non-API Platforms
For platforms not managed via API, only the number of objects we have information for are displayed, which is often the number of review URLs. If no information is provided, only the setup button is present.
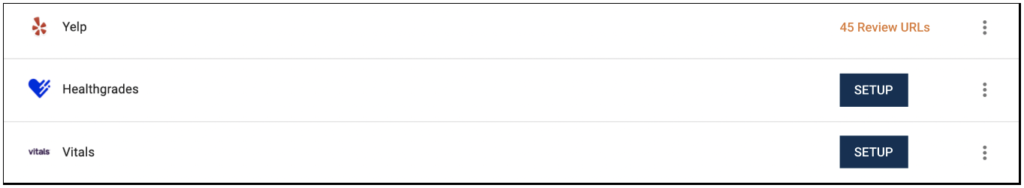
The triple dot options for these platforms are as follows:
- Manage Review URLs
- Refresh Data
We’ve also replaced the orange + button in the corner with a new Add Platform dropdown menu, which will provide options to add new provider/location platforms as well as create a new survey.
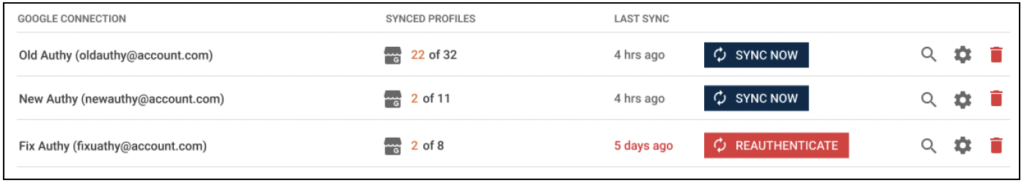
Connect Platform Page – Visibility Enhancements—We’ve made some updates to the Connect Platforms page to provide you with more clarity around the state of individual authenticated connections while managing them.
The header now includes the sign-in to the platform, instead of including it below.

We’ve also made the following changes to the Connection List:
- Removed the selector and sync button.
- Standardized the formatting of the connection name and email.
- Added a column to display the number of profiles linked to an authentication.
- The icon is a gray version of what is shown in the header (either Google or Facebook). The count represents the number of listings or pages tied to that auth which we are actively syncing, and how many listings are available to be synced using that auth.
- Added a column showing the last time we synced the listing or page.
- Added a “Sync Now” button to each individual connection.
- The
 icons to “Bypass Downloading Locations (SocialClimb),” “Profile Config,” and “Remove Auth” have been adjusted for styling.
 - Added a Reauthenticate button that is only displayed if a connection has a problem (Auth has expired, etc) that requires a user to reauth.
Google API Cleanup—Google is sunsetting the old Google Business Profile API at the end of April. We’ve updated to the new APIs to get ahead of the change and prevent any interruptions to our users when Google changes things on their end. The work in this release checks for any remaining connections we have to the old API and moves them to the new one.
Release Call Trackers From Removed Google/Instagram Campaigns—When Google or Instagram campaigns are deleted, we now remove and release any call tracking phone numbers associated with those campaigns. Reporting functionality for those numbers is still available.
Backload Historic Data for the Marketing Report—We have added the ability to backload any historic data in the app. This allows us to report on what is a new patient more accurately and from a wider range than when someone first became a customer.
Modernizing Medicine Direct Integration—We’ve created a direction integration option for this EHR in order to help our integration team get new customers up and running more quickly and to provide existing customers with a more stable connection.
Ability to Manage Subspecialties—We’ve added a new area where sub-specialties can be managed.
New Cardiology Predictive Models—Six brand new predictive models have been created for Cardiology. These models are built around individuals likely to be at risk for the following diagnoses:
- Acute Myocardial Infarction
- Angina
- Atrial Fibrillation
- Congestive Heart Failure
- Coronary Artery Disease
- Irregular Heart Rhythm
Continuing to add these predictive models to our system allows you to be more intentional and specific with your marketing efforts. Ultimately, this allows you to be more efficient in patient acquisition and specifically target your ideal patients.
Delete and Update Counts for All Predictive Models—Each quarter we receive new data for these models. This release refreshes the data for the quarter and updates all the counts when running/creating predictive models.
Require Account Specialties—When new accounts are created, the specialty is now a required field. This helps us maintain more complete data and allows us to use that information for data analysis and other efforts. All existing accounts have had their specialties added.
SocialClimb Infrastructure Updates—In this release, we’ve made improvements to the infrastructure used to build and maintain our platform. These improvements make it easier for our engineers to make updates and ensure the smooth running of our application.
Improvements 4/6/22
Survey Dashboard—Some HUGE improvements are underway for Surveys. The goal of these changes is to make survey metrics easier to understand. Creating a survey-specific dashboard is the first step toward achieving this goal. This dashboard can be viewed by clicking the new “Survey Dashboard” option under Surveys in the left navigation menu.
Here is what the new dashboard looks like:
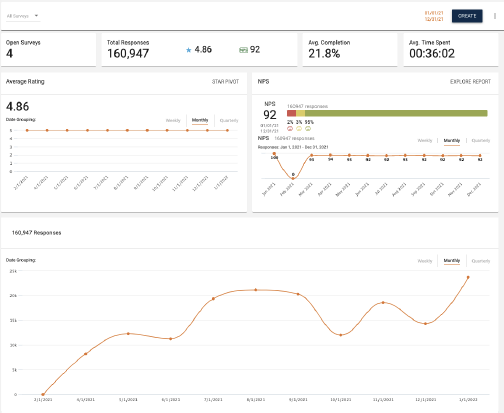
Filter/Date Bar
The first row of the dashboard contains a dropdown with all surveys, which can also be multi-selected. A date selector is also found here, along with a button to create a new survey.

Metrics Bar
The second row of the dashboard contains survey metrics, which update according to the filters.

- Surveys – A summary of how many total surveys you have, according to the filters you have in place on the dashboard.
- Total Responses – The number of survey responses received in the filtered timeframe, along with the average star rating and NPS score of the responses.
- Avg Completion – The percentage of patients who completed the survey.
- Avg Time Spent – The average amount of time patients spend completing the filtered survey(s).
Graphical Displays
The third row of the dashboard contains visualizations of survey data.
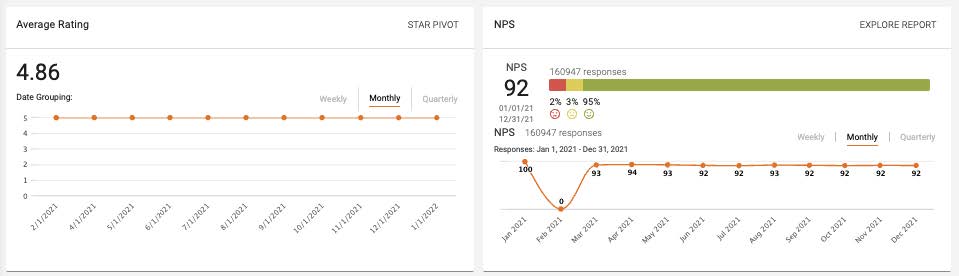
- Average Rating – This box reflects the average star rating on a line graph. The y-axis shows the star ratings on a 1 – 5 scale, while the x-axis shows a timeline, which is set to Monthly by default, though users can toggle between Daily, Weekly, and Monthly views. Clicking the VIEW REPORT option in the upper right corner takes users to the Star Pivot report.
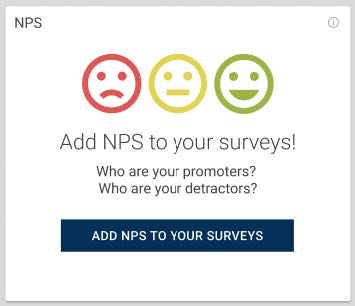
- NPS – This box displays NPS survey results. The number next to the bar chart reflects the total number of responses for the selected timeframe. The line graph is a visual representation of the NPS number over time. Clicking the VIEW REPORT option in the upper right corner takes users to the NPS Report.
- Note: If customers are not using NPS surveys, the following placeholder image is displayed instead:
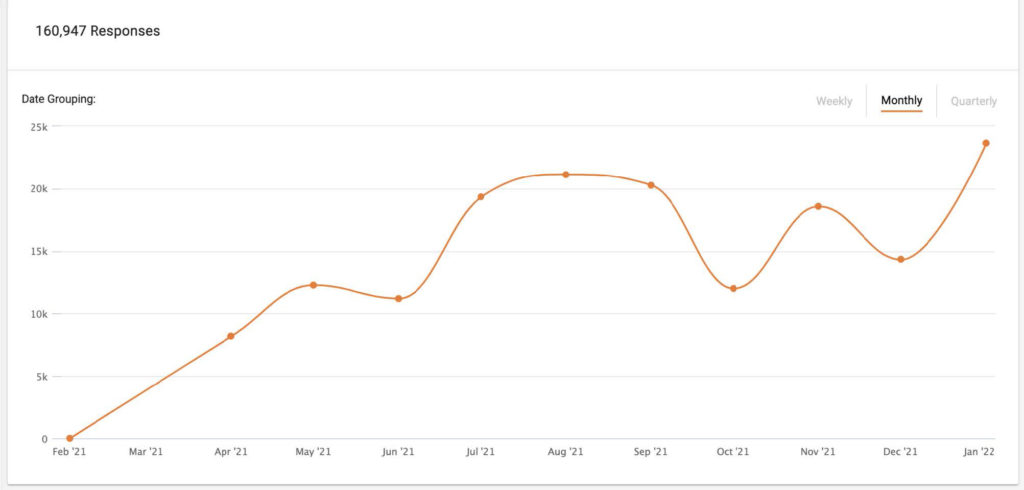
The last row displays the total number of survey responses over time. By default, this view is set to Monthly but users can toggle between Daily, Weekly, and Monthly views.
Manage Surveys Page Update—Along with the new Surveys Dashboard, the Manage Surveys page is also getting a massive update in order to better support Surveys being sold as a standalone product and to provide users with more useful reporting information at a glance. Here’s what it looks like:
The Search Bar, Create Button, & Triple Dot
- The “Select Survey” dropdown can be used to select one or all surveys.
- The “Create” button takes users to the current survey creation flow.
- From the triple dot, users can export and disable surveys.
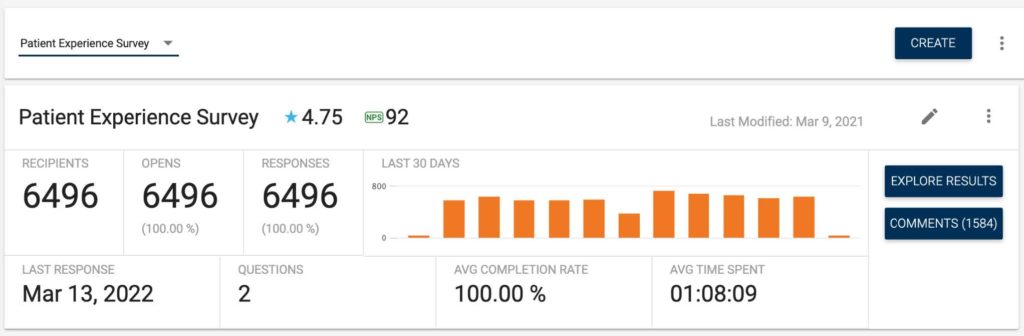
The Survey Card
Each survey is displayed in its own card. The survey card gives a summary of some of the stats for each survey as well as the ability to edit the survey and to drill down into results at a deeper level. Each survey gets its own card. The top line shows the name of the survey, the all-time star rating, and all-time NPS.
The upper right corner displays the Last Modified date, which is the last time an edit was made to the survey questions, and the pencil icon to edit the survey. The triple dot allows users to copy or edit the survey.
The Metrics
These convey how the survey is interacted with and are specific to the survey on the card.
- Recipients – The total number of times an invitation was sent with the survey.
- Opens – The number of times the invitation was opened (calculated by dividing the number of opens by the number of recipients).
- Responses – The number of times the survey was completed (calculated by dividing the number of responses by the number of opens).
- Bar graph – Displays the number of responses over the last 30 days. The x-axis represents the days, while the y-axis represents the number of responses in the given timeframe.
- Explore Results button – Takes users to the “Survey Summary” page, filtered to the specific survey of the card where the button was clicked.
- Comments button – Takes users to the comment report for that survey, similar to if they clicked the comment icon from the survey summary page.
The second row contains additional metrics:
- Last Response – The date of the last time a recipient responded to the survey.
- Questions – The number of questions in the survey.
- Avg Completion Rate – The percentage of patients who completed the survey.
- Avg Time Spent – The average amount of time recipients spend completing the survey.
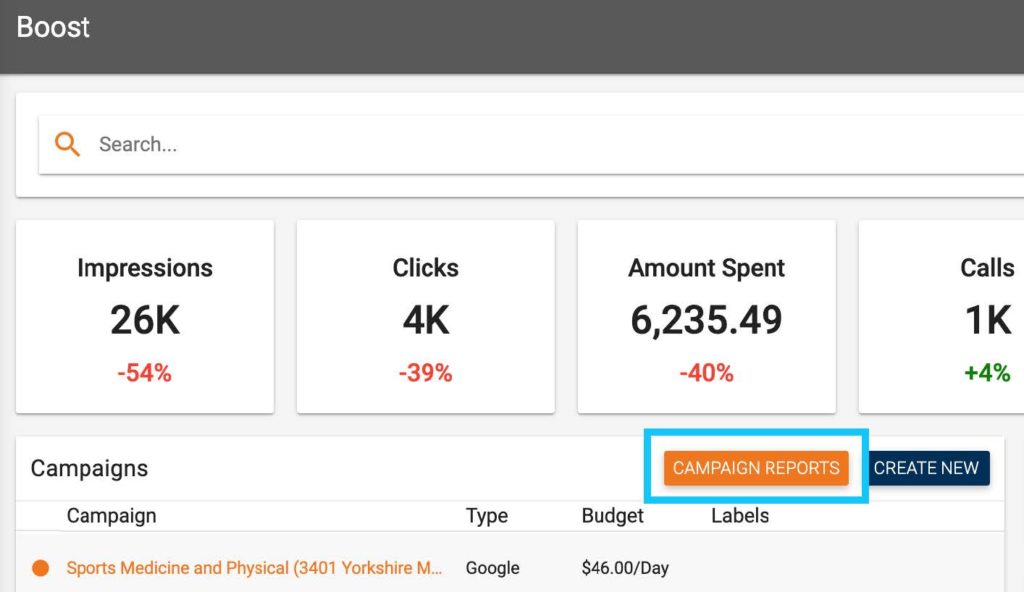
Boost Reporting—You can see an individual campaign’s performance in the campaign view and can compare cost and call data from the Marketing Report, but there wasn’t an easy way to access a full comparative view. As a result, too much of our team’s time is spent helping to pull reports instead of actually working to improve performance. In order to help alleviate these manual processes and to provide you with a better understanding of the value of Boost campaigns, we’ve created a new reporting view so you can easily measure and compare results of your campaigns.
Navigating to the Report
You can navigate to this report by clicking the new “Campaign Reports” button on the main Boost page.
The Report
After clicking the “Campaign Reports” button from the main Boost screen, you are shown the following report:
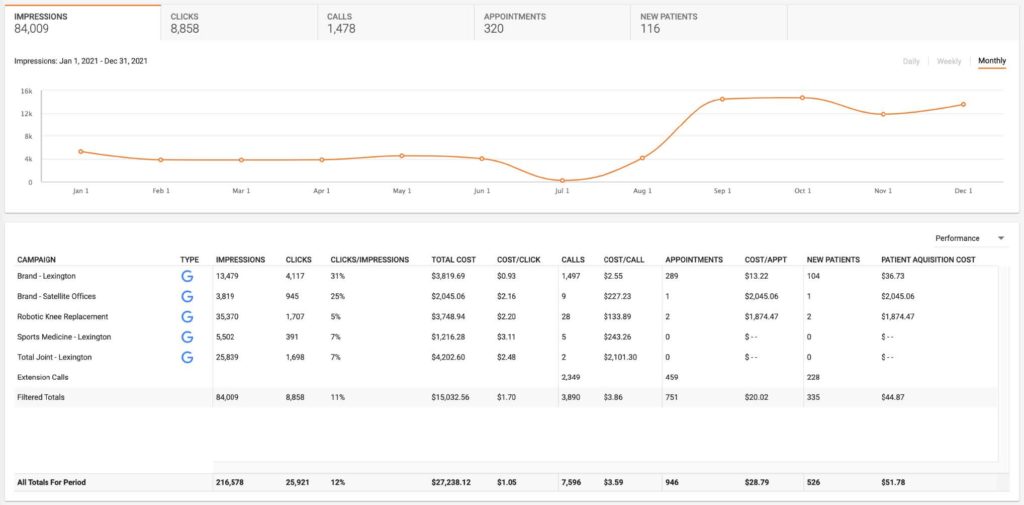
Visualization
The visualization for this report is a line graph with the x-axis being time and the y-axis being the metric. You can view different metrics by clicking one of the tabs above the line graph. You can also toggle between Daily, Weekly, and Monthly timeframes.

Filtering
The following fields can be used in the search bar to filter the report:
- Campaign Status
- Campaign Name
- Type
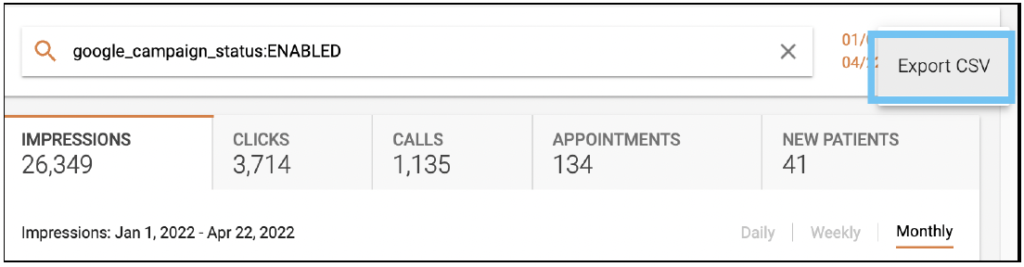
By default, the report is filtered to display active campaigns. The filtering for this report has some unique functionality in that it displays the filtered totals, as well as unfiltered totals.
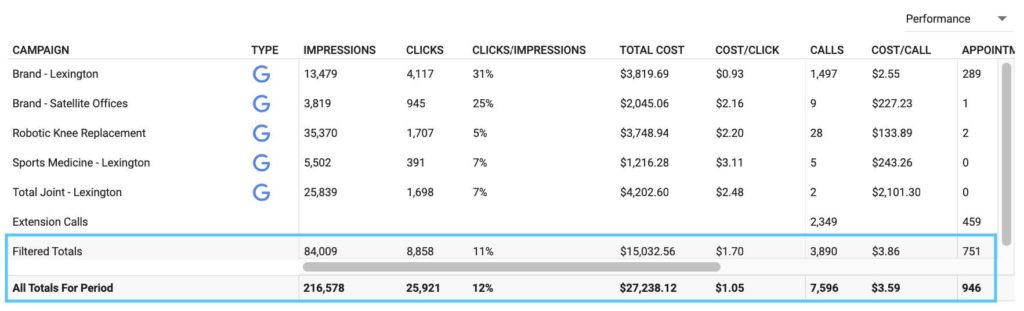
All calls attributed to Boost that came from a location extension are grouped into a single line, as shown below the Total Joint-Lexington campaign above. These will always show if there are any Google campaigns with a status of “Active” and the “Status” filter is used. These should also always show if Google is included in a filter by “Type.” They should not show if there is any filtering by campaign.
The dropdown menu in the upper right corner of this section allows users to select from the following presets for reporting: Performance (Default), Calls, Cost, and Visibility.
Each reporting preset uses unique columns to convey the most relevant information for each view. The columns for each preset are listed below.
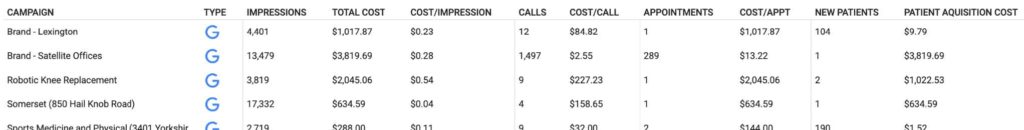
Performance Reporting
This report provides a high level overview of all the metrics.
- Impressions
- Clicks
- CTR (Click Through Rate) – Calculated as clicks/impressions
- Total Cost
- CPC (Cost Per Click)- Calculated as cost/clicks
- Calls
- Cost/Call
- Appointments
- Cost/Appt
- New Patients
- Patient Acquisition Cost

Call Reporting
This report adds a little more context to the calls.
- Total Cost
- Calls
- Call Rate – Calculated as calls/clicks.
- Cost/Call
- Appointments
- Appointment Rate – Calculated as appointments/calls.
- Cost/Appt
- New Patients
- Acquisition Rate
- Patient Acquisition Cost
- Minutes – This needs to be a sum of each call, rounded up to the nearest minute.
- Avg Minutes/Call – Calculates as minutes/calls. This one should be rounded to one decimal point.
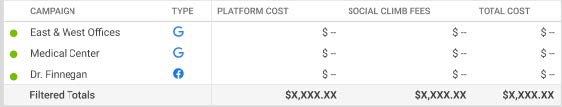
Cost Reporting
This report helps us meet some of Google’s requirements on transparency.
- Platform Cost – The cost from the actual engine, ie. Google or Facebook.
- SocialClimb Fees – Our cut of the total cost.
- Total Cost – What we normally display as cost.
Visibility Reporting
This report helps users understand how much it costs to get in front of potential patients, in terms of impressions.
- Impressions
- Total Cost
- CPM (Cost per 1,000 impressions)
- Calls ● Cost/Call
- Appointments
- Cost/Appt
- New Patients
- Patient Acquisition Cost

HL7 Mapper—Health Level Seven (HL7) is a set of international standards used for transferring and sharing data between various healthcare providers. This update allows us to determine how transferred data is parsed out.
HL7 Rules Engine—This update puts rules in place to manage how the data parsed out by the previous ticket is used.
Remove Welltok Models From Predictive Analytics—Our contract with Welltok, our predictive model provider, has ended. Their models allowed us to target by zip code, but not by individual without incurring significant cost. All models from Welltok have been removed from the system. The number of models available for use in Predictive Analytics is significantly smaller, but all models can now be used to target individual prospects. The list of models we build ourselves will continue to grow over time.
Add Start and End Dates to Scheduled InvitesPage—When someone manually triggers our integrations, we’re able to select a time frame. For troubleshooting purposes, it helps to know which time frame was used when manually triggering the integration. Start and end dates have been added to facilitate this process.
Download Skips—The ability to download the skips from scheduled invites has been added to the triple dot menu. This will more easily give insight into the people we did not send invites to.
Header For Rule Groups—We’ve added a header that shows the rule group name, the connection name, and kind of connection. This will make it easy to identify exactly what is being worked on.
Display Rule Numbers—When in a rule group, we’ve added a number to the rule to aid in troubleshooting and communicating about rules.
Patient Point Access API—We’ve added an integration with PatientPoint Access in-office display system to show SocialClimb reviews. SocialClimb will generate images per month per physical location. These images will represent a provider who has the most reviews in that location.
Elation Integration—We’ve added another direct integration, this time with Elation. This will help improve the process of integration with customers using the Elation practice management system.
SocialClimb Infrastructure Updates—In this release, we’ve made improvements to the infrastructure used to build and maintain our platform. These improvements make it easier for our engineers to make updates and ensure smooth running of our application.
Improvements 3/16/22
Marketing Report Cost-Cost Uploads—To improve the ability for our customers to more accurately report on external marketing campaigns, you can now manage these costs via upload. You can do this both from the triple dot on the Marketing Report as well as the triple dot on the Cost Entry page.
The following fields are required for upload: Name, Channel, Cost, Cost Type, Start Date, and End Date. The following options can be used for the Cost Type:
- Recurring – Daily
- Recurring – Monthly
- Recurring – Quarterly
- Recurring – Yearly
- Total for Period
- Fixed
Currently, the only accepted file type for upload is .csv, and you can download a sample CSV in order to format your data correctly before uploading.
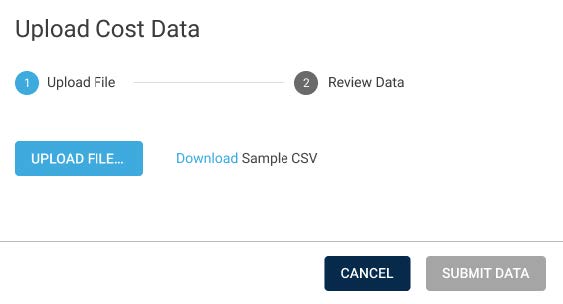
If you attempt to use a different file type or if the data is not formatted correctly, the file will not be uploaded, and you will see an error message indicating the reason the file could not be uploaded. You can also edit the Channel, Source, Campaign, and Name from this screen.
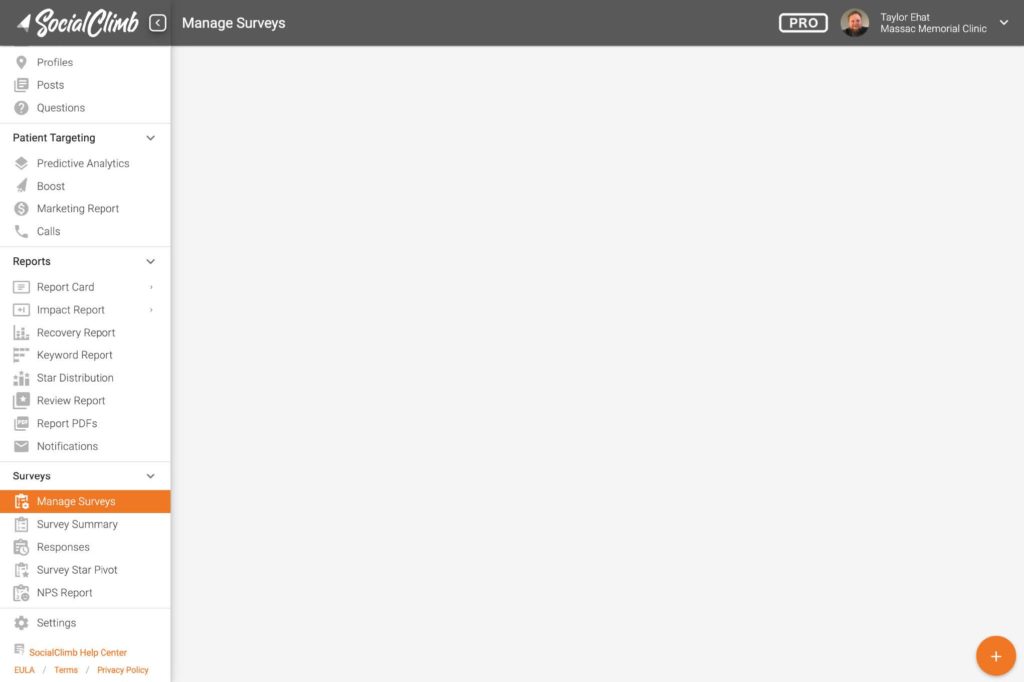
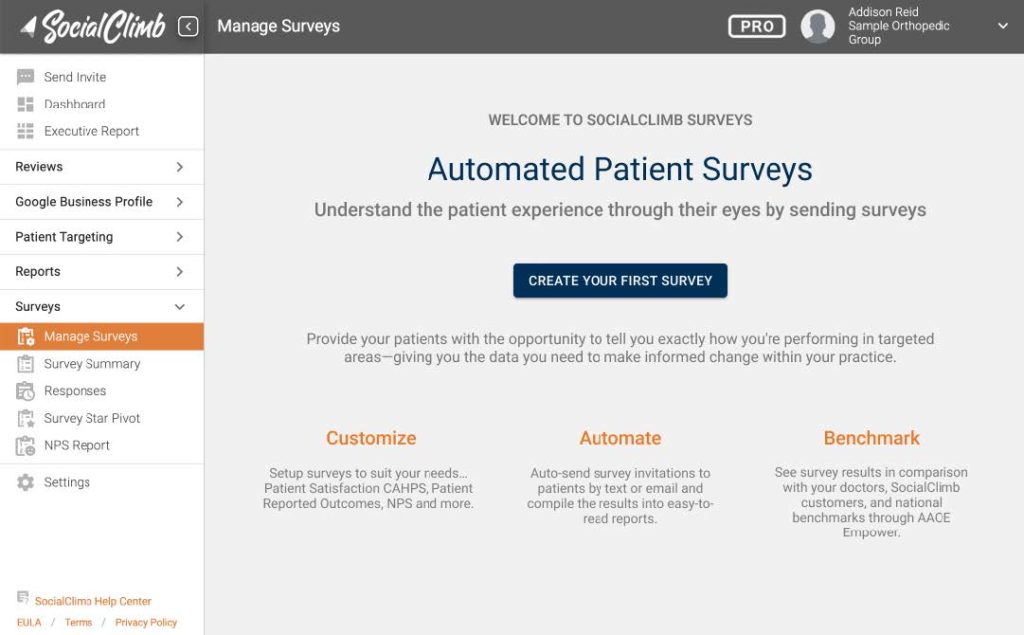
 Manage Surveys View for First Time Users—This update includes some great improvements to the user experience for our Survey feature. Customers viewing the Manage surveys page in the platform without having ever created a survey before were met with a blank page and the orange “Add Survey” button in the lower right corner. This wasn’t an ideal customer experience, so we’ve created a much more informative page to help you get started with our excellent survey tool.
Google Business Profile API Updates—Google is sunsetting the old GBP API at the end of April, so we have updated to the new APIs to get ahead of the change and prevent any interruptions to our users when Google changes things on their end. The new framework opens up some new possibilities for us to leverage in the future, but this release just focuses on changing to the new API.
Marketing Report Speed Improvements—We optimized the queries of the marketing report to improve the speed and performance of the report. This will be most noticeable on accounts that have high call volumes.
Improvements 2/23/22
Manage SFTP Integration Connections with File Transforms—The implementation team can now manage and troubleshoot Secure File Transfer Protocol (SFTP) integrations. Moving the management here means integrations that are done through SFTP will not require engineering to be configured and will not require a hotfix release to deploy.
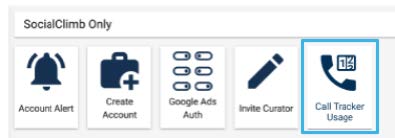
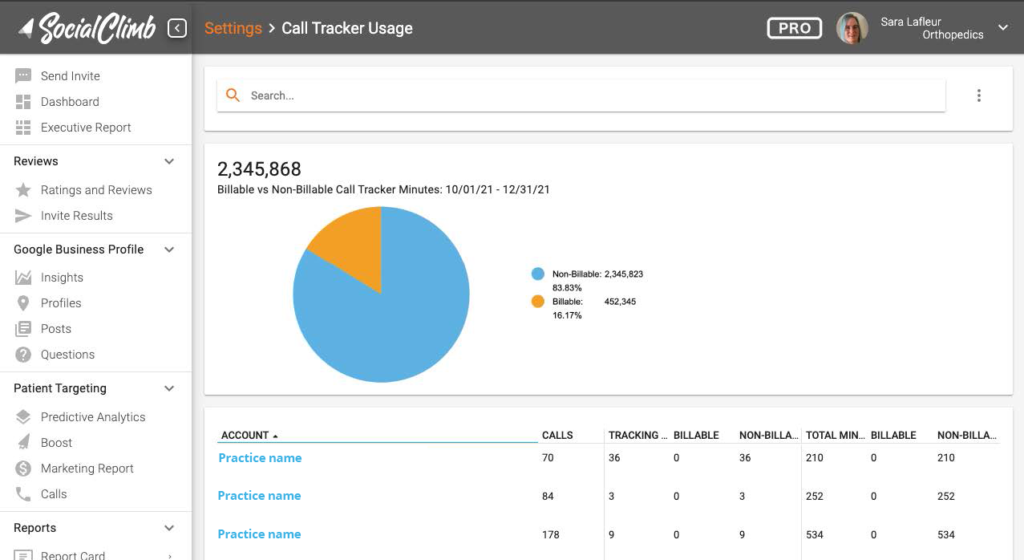
View Internal Call Reporting—Because of the way some customers use Call Tracking, we need to bill them based on usage. A new report has been created in the app to allow us to do so. The Call Tracker Usage report is found in Settings under the “SocialClimb Only” section with the following icon:
The report displays the following information:
- Total Call Tracker Minutes
- Billable vs non-billable minutes, shown in the pie chart as percentages
- All accounts using call tracking numbers
- The number of calls from call tracking numbers
- How many call tracking numbers they have active during the defined time range
- How many numbers are billable vs non-billable
- The total call minutes, rounded up to the nearest minute
- How many call minutes are billable vs non-billable
Users can view historical data for this report and download a CSV of this report by selecting the “Export CSV” option from the triple dot near the date selector.
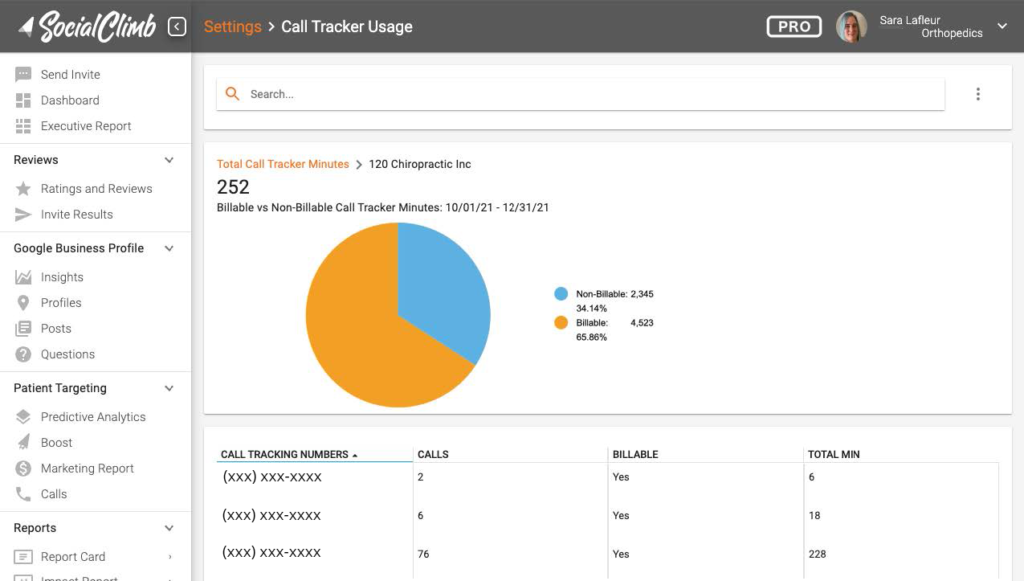
After clicking a client account, a more detailed view is displayed. When a single client account has been selected, the data reflects information applicable to only that account. Along with the pie chart, this detailed view shows the following information:
- Individual call tracking numbers
- The number of calls per number
- Whether the numbers are billable vs non-billable
- Total minutes per number
This report can also be downloaded as a CSV from the triple dot menu.
Access New Ophthalmology Models—Three new Instagram-specific predictive models have been created for Ophthalmology. These models are built around individuals likely to be interested in glaucoma, lasik, and vitrectomy procedures. Continuing to add these predictive models to our system allows you to be more intentional and specific with your marketing efforts. Ultimately, this allows you to be more efficient in patient acquisition and specifically target your ideal patients.
See Campaign Platform Logos on Boost Campaign Detail View—When viewing or editing Boost campaigns, you will now see logos that identify which platform the campaign is on, such as Google or Facebook.
Update Marketing Report Downloads—Changes made in the previous release added totals to the table and included costs. The PDF and CSV reports have been updated to reflect these changes. Non-monetary numbers have been formatted to include commas at the thousands, and percentage symbols added to the CSV have been removed so that the CSV displays raw data.
Apply SocialClimb Fees to Instagram/Facebook Campaigns—Creating an Instagram ad now takes into account the options entered in the Fees and Revenue Share Rate sections of the Manage Boost page. This functionality already exists for Google Ads, and we realized we needed to apply the same rules and functionality to Instagram/Facebook ads. This is an important improvement because it further empowers you by providing a more accurate view into what you’re actually spending and prevents us from spending more than you wants to on Facebook. The default settings for these sections are as follows:
- Fees—20% of Total Spend
- Revenue Share Rate—100% Revenue Share
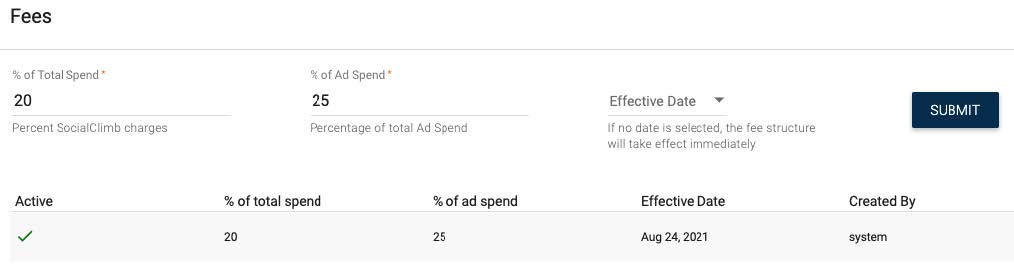
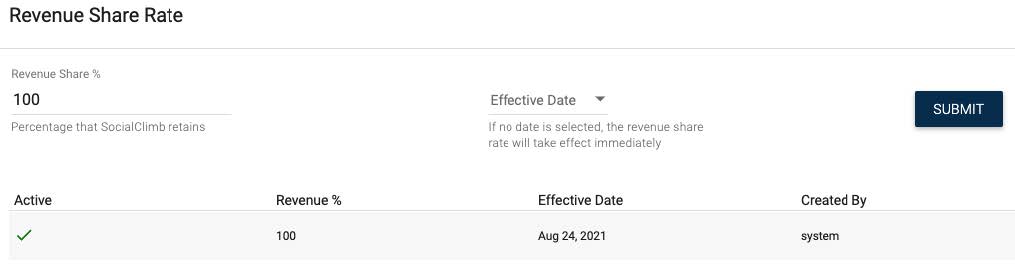
These settings are used to calculate the cost paid to SocialClimb, which is displayed in the UI with the cost on the Boost page, the Boost campaign page, and the Marketing Report. They’re also used to calculate the budget sent to Facebook and Google. For example, if you want to spend $10 a day, and 20% of that budget goes to SocialClimb, the budget should be set to $8/day instead of $10/day.
Improved Handling of Cost Data on the Marketing Report—You can now pull from a predefined set of creative assets. This allows you to launch Facebook/Instagram campaigns without having to create your own unique assets. We can help you use ad formats that are already optimized, and give you a library of assets to choose from.
Changed Parameters for Generating Call Tracking Numbers on GBP Listings—When creating Boost campaigns, a call tracking number is generated for the campaign. Additionally, if a listing has not been used in a campaign yet, a call tracking number is generated for the location extension. If a listing is already in use but has not previously been used in Boost, we add a call tracking number to the GBP listing itself.
We are selling these call trackers separately now, so they will no longer be automatically generated just because a Boost campaign with those listings was created.
Changed How We Calculate Insight Data—We’ve changed how we display data on the insights tab to only show data from listings we are currently syncing data for. This eliminates the drops in data due to a different set of data being evaluated.
Updated SocialClimb Infrastructure—In this release we’ve made improvements to the infrastructure used to build and maintain our platform. These improvements make it easier for our engineers to make updates and ensure smooth running of our application. Updates include the following:
- SSL Certificates used in certain environments will now automatically renewed
- Updates have been made to our python dependencies and how that code is used
- An issue that added unexpected spacing in code, which introduced errors, has been fixed
Improvements 2/2/22
- Test Run Integrations—We can now test run integrations. This gives us better ability to test and troubleshoot not just transform rule changes but also account configuration.
-
Report on Costs from External Campaigns—To make the marketing report a more holistic representation of patient acquisition costs, we’ve added the ability to report on costs that we are not generating through using our application. Any campaigns that we have call tracking numbers for can now show cost within the application.
-
Notify Only on New Config Errors—To make it more obvious when new config errors happen, we have adjusted the config error notifications to only send notifications when new config errors happen, instead of sending all config errors that have not been dealt with.
-
Make Phone Numbers Easier to Read—We’ve adjusted the way we display call tracking phone numbers to improve readability.
-
Show Whether the Call Tracking Script is Implemented Within the Application—We’ve added the ability to show whether the call tracking script is properly implemented on a site. You can also test implementation on the script directly within the application.
-
Create Facebook/Instagram Campaigns More Easily—We’ve simplified the process of creating a campaign on Facebook/Instagram campaigns. Facebook/Instagram have a lot of options. Instead of giving a user all the different choices, we have simplified the flow to push to best practices.
-
Use Creative Asset Playbooks for Facebook/Instagram Campaigns—You can now pull from a predefined set of creative assets. This allows them to launch Facebook/Instagram campaigns without having to create their own unique assets. We can help them use ad formats that are already optimized, and give them a library of assets to choose from.
-
Download the Marketing Report—The marketing report can now be downloaded as a PDF and a CSV. You can now download and distribute the report, and get access to the data to use for any external reporting.
Improvements 1/11/22
- Directly Integrate with Denticon—We continue to add support for more direct integration options. We now support direct integrations with Denticon.
-
Receive Notification within the Application When Transform Rules Filter on Providers or Locations—Transform rules that filter on providers or locations can cause config errors to not trigger. We now notify users of this when creating rules that could cause this behavior.
-
Define and Assign Audiences for Facebook/Instagram More Easily—We have simplified the way audiences are assigned to Facebook and Instagram campaigns to only support a single targeting type per campaign. This will help prevent users from inadvertently making audiences so narrow that we cannot serve ads to them. We also notify users of the effects of switching targeting type as they take action.
-
Manage Facebook/Instagram Budgets More Easily—We have aligned Facebook/Instagram campaigns to only use a daily budget. This aligns with how Boost campaigns work on Google. Though Facebook and Instagram offer other options, simplifying to a single path makes the creation flow less complex, and keeps management simpler.
-
Schedule Ads For Facebook and Instagram Campaigns More Easily—By simplifying budget options, we could also simplify the scheduling of ads. This cuts an entire step from the creation flow, making launching a campaign even easier.
-
Adjust Data Model of the Marketing Report to Support Cost Management—We made a change to the way we model the data displayed on the marketing report to use the campaign instead of calls. This means we will show data for campaigns that have cost even if there are no calls yet associated with that campaign. This also sets us up to start showing and defining costs for channels/sources/campaigns where the cost is not generated by our application.
-
Manage and Report on Marketing Costs Not Generated By Our Application—The marketing report shows patient acquisition cost for tactics with cost managed through our application. To make the marketing report a more holistic representation of patient acquisition costs, we’ve added the ability to manage costs that we are not generating through using our application. This release allows for managing the cost, and sets us up to report on patient acquisition cost for any tactic that we are tracking with call tracking numbers in a future release.
-
Edit the Numbers Call Tracking Numbers Route To—Editing where a call tracking number routes to has historically been something that had to be done by engineering. Users can now control and edit where call tracking numbers go, whether they are custom campaigns or generated by our application.
-
Send Instructions to Implement Our Call Tracking Script—The person that places the call tracking script on a customer’s site is often not the same person that manages things in the application. A user can now send the call tracking script, along with instructions on how to implement it to whoever they need to.
Improvements 12/14/21
-
Populate the Rules Engine with Sample Data—When setting rules for the integration, you can now run sample data from the account to see data as it currently exists. This will make setting up an integration initially simpler and also improve the ability to troubleshoot.
-
Disable HL7 Integrations—HL7 integrations can now be disabled. We will not process the data and will not send any invites. This adds the ability to schedule launching the integration.
-
Better Formatting of HL7 Segments—HL7 messages now format segments onto separate lines. This improves the readability and more accurately reflects the HL7 standard formatting.
-
Integration with the Nextgen Appointment Data Staging Environment—We have now integrated with the staging environment for Nextgen. We can begin Nextgen store approval, which is the next step to being able to directly integrate with Nextgen.
-
Add a Flag for Billable Call Tracking Numbers—A lot of call tracking numbers are not billable, while some are billable. Having the ability to distinguish between billable and nonbillable tracking numbers will set us up to be able to report on usage by type.
-
Increased Flexibility on Web Call Tracking—The call tracking script can now rotate a number that is not the same number it routes to. If a site uses a standard number, the script can be instructed to rotate that number out as well.
-
Updated References to Google My Business—Google has renamed Google My Business to Google Business Profiles. We’ve updated how we refer to it in the app.
-
Facebook/Instagram Edit Campaign Page—We built a page to easily report on the performance of an individual campaign. Edits at the campaign page can also be managed.
-
Better Date Comparisons on the Review Report—You can now control how dates are displayed, giving a user more flexibility to compare and report.
-
Refactored How We Handle Objects for Instagram Ads—We moved objects in the backend to allow simpler calls and improve how we handle subobjects.
-
Better Handling of the Display of Stars on the Ratings & Reviews PDF—We’ve improved how we handle stars to more closely match how they are reported on the Ratings and Review webpage. They no longer round down to the nearest whole star.
Improvements 11/18/21
- Simplified Message Selection in Transform Rules—Instead of having to input a message ID into a change rule, you can now select the message from a list of available options.
- Export the Review Report to a .csv File—The data from the review report can now be exported to a .csv file for sharing or other data manipulation.
- Improved the Responsiveness of the Config Error Page—The query for the config error page has been optimized to load quickly, even for very large amounts of data.
- Added the Ability to Filter Columns to the Config Error Page—Columns can be removed from the Config Error page, allowing for copying when necessary.
- Added a Download Option to Silenced Config Errors—Silenced config errors can now be downloaded.
- Breakout Survey Summary and Management—Managing surveys has been separated into a separate page from the survey summary reporting. This is the first step in making surveys easier to manage and understand.
- Securely Transfer Login Details In the Application—In instances where we need to capture login details to get a customer setup, the login details can now be securely shared within the application. This eliminates sending login information via email.
- Show and Filter Deleted Campaigns in Boost—You can now see and filter on deleted campaigns for both Instagram and Facebook, allowing you to see performance of campaigns that have been removed or deleted.
- Create Call Tracking Numbers to the Campaign Level on Instagram & Facebook—To follow existing patterns within the application, we’ve moved the creation of call tracking numbers from the ad to the campaign level on Facebook/Instagram.
- Generic Demographic Targeting for Facebook/Instagram—We have added the ability to target an audience not created by predictive analytics. This makes Facebook/Instagram ads available to a wider audience, but the ads will not be as tightly targeted as using predictive audiences.
- Report on Facebook/Instagram Campaigns—Facebook and Instagram campaigns now correctly report in the Boost overview page and the Marketing Report.
- Tie Call Tracking to Facebook/Instagram Campaigns—Facebook and Instagram Ads now create call tracking numbers to give full insight into which campaigns are generating calls, appointments and new patients.
- Optimized the Flow for Uploading a Predictive Audience—Predictive Audiences now upload behind the scenes for a user, making the creation flow for Facebook/Instagram campaigns faster.
- Added Comments to the Ratings & Reviews Export—Comments were added to the Ratings & Reviews PDF export, making the PDF more closely match the data displayed on the ratings and reviews page.
- Improved Reliability of Scraping Healthgrades—We’ve moved the Healthgrades scraper to a proxy to improve our reliability of scraping.
Improvements 10/26/21
- Simplified Message Selection in Transform Rules—Instead of having to input a message ID into a change rule, you can now select the message from a list of available options.
- Management of Integrations by Implementation Without Relying on Development—New integration connections are disabled by default, and connections can now be edited while disabled, giving implementation the ability to better troubleshoot actual customer data when creating rules. New HealthJump and Athena integrations no longer require development to code account values, giving implementation the ability to launch new customers without involving development and deploys.
- Direct Integration with Nextech—Another direct integration! Better data. Improved reliability. We now support Nextech Practice+ and Select solutions.
- Better Understanding of Config Errors—We’ve added additional information to allow for improved troubleshooting of config errors. You can now see the first time a config error was seen, the last time it was seen, and the number of times it was seen.
Improvements 10/5/21
- Enable Transform Creation Without Development Resources—The UI has been improved to allow for the creation of most transforms without the need for developers. This enables a streamlined integration process and an improved ability to make adjustments.
- Additional Support for Privia Athena Connections—We can now support pulling in individual provider groups from Athena when they are part of the Privia group. This allows integration with provider groups without hardcoding the ID.
- Fire Report Card Actions Group Is Now the Same as Scheduled Reports—Manually fired report cards now group email notifications in the same way as when they are automatically fired.
- Improvements to Twilio Brand for AT&T and T-Mobile—We have improved the handling of phone numbers for submission including better error handling. No more requirements for messaging service and invites are being sent. Resubmitting doesn’t re-create the brand profile. This has been done to ensure that our customers are able to message their customers and that registering to do so is as smooth a process as possible.
- Better Survey Response Filtering—The Survey Summary can now be filtered by question.
- Easier Visualization of Locations—When filtering by locations on the Review Report, the address is now displayed to more easily identify locations that share a name.
Improvements 9/16/21
- Ensure Deliverability of Text Messages—Cell phone carriers (T-Mobile, AT&T, etc.) are requiring additional business profile Information to deliver SMS and MMS messages to customers. Without this information, they could start limiting delivery of messages. We have added a way to collect and pass on the needed information to validate business profile information for our customers.
- Create Ads Optimized for the Most Important Conversion Points—About 90% of appointments are still scheduled by phone. That is the main conversion point that we push ad traffic toward. Google has an ad type called “Call Ads” that are optimized for driving calls instead of clicks. We now support the creation of Call Ads. They can be added to playbooks or manually added to any campaigns.
- Richer Ads to Increase Engagement—Ads on Google can be extended to increase engagement. We have added support for Callouts, which allows the ability to supplement ad data with additional data, such as “Accepts Most Insurance.” It’s another way to provide more information within the constraints of ads. We also now support Sitelinks, which gives the ability to add links to other sections of a site from the ad, such as the “Contact Us” page.
- Find Ad Groups in a Campaign More Easily—Ad groups can now be sorted from the campaign view of Boost to more easily find specific ads.
- Filter Locations Based on Needed Scorecard Improvements—Optimizing GMB pages is now simpler with a filter view that only shows listings that need certain scorecard items updated. Customers can now focus on and find all the listings that are missing data we track with the scorecard.
- Understand and See All Active Call Tracking Numbers—The added functionality of our call tracking solution is better summarized on the Call Tracking Numbers settings page. Customers can now get a complete view of all their active call tracking numbers.
- Manage Athena Integrations in the Application—Setting up the rules of an integration is now possible using the rules engine, giving the ability to manage and create the transform rules without using development resources, and adding the ability to see the impact of changes to the rules.
- Google My Business API Update—Google has moved the Google My Business APIs to a new federated model. The application was updated to accommodate these changes.
- Include NPS Questions on Survey Reporting the Reports on Positive Answers—When creating a survey question, answers can be marked as positive. This allows for some reporting around whether the percent of answers to a question are positive or not. NPS now automatically flags answers from “Promoters” as positive. This makes NPS questions relevant to those reports.
- Better Track Calls from Older or Existing Boost Campaigns—We have added functionality to improve our ability to track calls over time; however, those changes have not been added retroactively to campaigns. We can now add call tracking fully to any existing campaigns.
- More Flexibility in How the Review iFrame Displays—We have added additional background color options to better customize the review iFrame to match a customer’s site.
Improvements 8/24/21
- Track Calls on Customer Websites That Come in Organically—The call tracking script that customers can place on their site now has the ability to track phone calls from non-controlled sources. Calls from Organic Search, Direct Traffic, Social Media, and Referring Sites can be automatically tracked with the flip of a toggle. This gives an understanding of what traffic sources are driving calls, appointments, and new patients.
- Improved Flexibility for Boost Cost and Fees—The cost displayed in Boost includes our fees. In the case of partners, such as agencies, they may have different fee structures than our contracts. Fee structure can now be defined within the application, giving better flexibility in how costs and budgets are displayed.
- Clearer Representation of Spend in Boost—The monthly budget displayed in Boost is now more accurate. Previously, the application took the daily budget and multiplied it by 30.4, which is the average number of days in a month. The result was that the displayed monthly budget did not represent what a client would spend in any given month with absolute accuracy. We now show the daily budget instead. If someone needs to know what they will spend in a month, it’s simple math.
- Ability to Save Reports on the Review Report—Users can now save time by saving searches on the review report. If there is data that a customer wants to look at regularly, it is now possible to save the query to use repeatedly.
- Increased Ability to Troubleshoot and Audit Integrations—Understanding why we do or do not send invites to patients is now easier. Getting insight into the data we are getting through the integrations has been improved, allowing for faster and simpler troubleshooting.
- Better Control of Integrations—Where we look for data when integrating has required code that was not visible in the UI. Those options are now selectable within the UI. This allows for quicker insight into what the transform rules are looking for, and improved ability to make changes to integrations without needing development resources.
- Rules Engine—90% of HealthJump integrations are now running through the rules engine. Managing transforms through code has a number of benefits: The ability to make adjustments without needing development resources; insight into what the transform rules are doing; faster processing of transforms; and less code to manage.
- Old Survey Data Converted to New NPS Reporting—Customers that were asking an NPS style question, formatted correctly, have had their data updated to make use of the NPS reporting suite.
- Find and Report on Specific Channels, Sources, or Campaigns—Users can now search and filter by channel, source, or campaigns on the marketing report. This improved ability will allow for better flexibility in drilling down on data within the marketing report.
Improvements 8/3/21
- Drill Down and Understand Exactly How Marketing Campaigns are Performing—To better gain insight into how marketing campaigns are performing, the marketing report now has improved navigation. You can drill down by channel or source to really understand where phone calls are coming from, and how individual channels, sources and campaigns are helping to drive more customers.
- A More Complete Picture of the Impact of Phone Calls—In addition to showing how many times people call, one of the benefits of SocialClimb has always been that we’ve been able to show how many of those calls resulted in bringing patients to a practice. To show a more complete view into what’s happening we now report on calls, the number of appointments scheduled as a result of those phone calls, and the number of new patients. Practices can now see how much it costs to acquire a patient, and how much they are spending to drive appointments and calls.
- Track Calls No Matter Where They Come From—To track the effectiveness of marketing campaigns, you can now create custom call tracking numbers to be used wherever advertising is going. Running a billboard? See how many people call after seeing it! Do you want to understand how well your agency is doing to drive new patients? We can do that! We have now enabled our customers to understand how any campaign they want to track is performing.
- Build Custom Reports for Reviews—We offer a number of reports for reviews, but occasionally our reporting doesn’t give a customer exactly what they are looking for. We now have a custom report builder to let a customer slice and dice data however their heart desires.
- Simplified Troubleshooting of Integrations—The integration team can now copy data directly from the rules engine to troubleshoot when using HealthJump’s DBX. The days of trying to fully write an SQL query are over! You can now copy parts of it.
Improvements 7/14/2021
- Improved Visibility Into Performance of Marketing Activities—To simplify the ability to slice and digest the impact of marketing activities, the marketing report has been completely reimagined. You can now view performance by channel, source, or campaign. You can also see details around the calls and appointments driven by each tactic.
- A More Complete Picture of the Impact of Campaigns—The ability to understand which phone calls lead to actually driving appointments and new patients is an important benefit of our platform. This update gives us the ability to attribute and track calls more completely by giving us the ability to track phone calls that occur from a customer’s site. We have added a snippet of code that can be added to a customer’s website which allows us to rotate call tracking numbers based on the advertising activity that drove the traffic to the site. All calls from Boost campaigns and GMB can now be tracked without any additional work by a customer outside of placing the code on their site.
- Increased Access to NPS Reporting—It is now easier to distribute NPS reporting. The NPS report can now be exported as a PDF and notifications can be configured.
- Benchmark NPS Performance Against Others—Practices curious about how their NPS scores stack up against other practices can now run benchmark reporting to compare themselves against the averages of other practices.
- Understanding of Campaign Budget on Performance—One of the most common questions with Boost ads is how much a customer needs to spend to maximize their exposure. In situations where a campaign’s budget is causing ads to not show as often as they could, we will now alert users and recommend the budget needed to make sure a campaign is getting as much visibility as possible. A campaign limited by budget almost always performs similarly after the budget limiting has been removed, so this will give customers insight into what they are leaving on the table.
- Optimization for Local Listing Visibility—A strong signal in local organic search optimization is NAP (Name, Address, Phone) consistency. In cases where we are tracking calls from GMB, we insert a tracking number that is unique, which means the listing does not have NAP consistency. In instances where we are tracking calls from GMB, we now insert the practice/provider’s actual phone number into the additional phone number field of GMB. We can then track calls accurately, and still provide the NAP consistency to help ensure the listing is ranking as well as possible.
- Improved Ability for Customer Success and Support to Service Our Customers—All system notifications relating to integrations now go to [email protected]. With all the recent changes to the customer success team, the CSMs in the system have been updated to represent the correct CSM assigned to an account.
- Simplified Account Settings—Settings that no longer changed functionality across accounts were removed to simplify the account settings.
- Handle Multiple Integration Types Per Account—It is not uncommon for a client to have different PM systems for different groups. Each of these may have different integrations, for example direct Athena and a HealthJump or SFTP. There is now visibility into each integration and the rules that apply to it.