Doctors, do all people visiting your practice receive equity of care? Do you want to better understand the patient experience of different demographic groups among your clients?
By using SocialClimb’s Demographic Report features, you can easily see feedback from diverse patient groups. Then, with statistically sound insights, you can address problems and set goals for your practice and individual providers.
You can easily track your progress over time to show continuous improvement for CAHPS, MIPS, PROMs, diversity initiatives, and more.
Display demographic data from reviews and surveys
SocialClimb correlates your patient survey and review responses to the demographic data already in your practice management system. Because SocialClimb is thoroughly integrated with your record system, the analysis is seamless and HIPAA compliant.
Show individual demographics
SocialClimb displays results for the following demographic categories:
- Age
- Gender
- Race
- Language preference
- Ethnicity
- Zip code
Combine demographic fields
For more granular insights, you can also filter results to show subsets from custom combinations. For example, you could show client feedback from women within a certain age group, or show feedback from Hispanic men.
Customize your view
SocialClimb’s demographic reporting gives you many ways to understand the experiences of different demographic groups.
You can see results by the number, or by sentiment or expression. Additional interactive features let you explore the data further–all to help you answer questions, and gain actionable insights to provide more equity of care to your patients.
View by the numbers
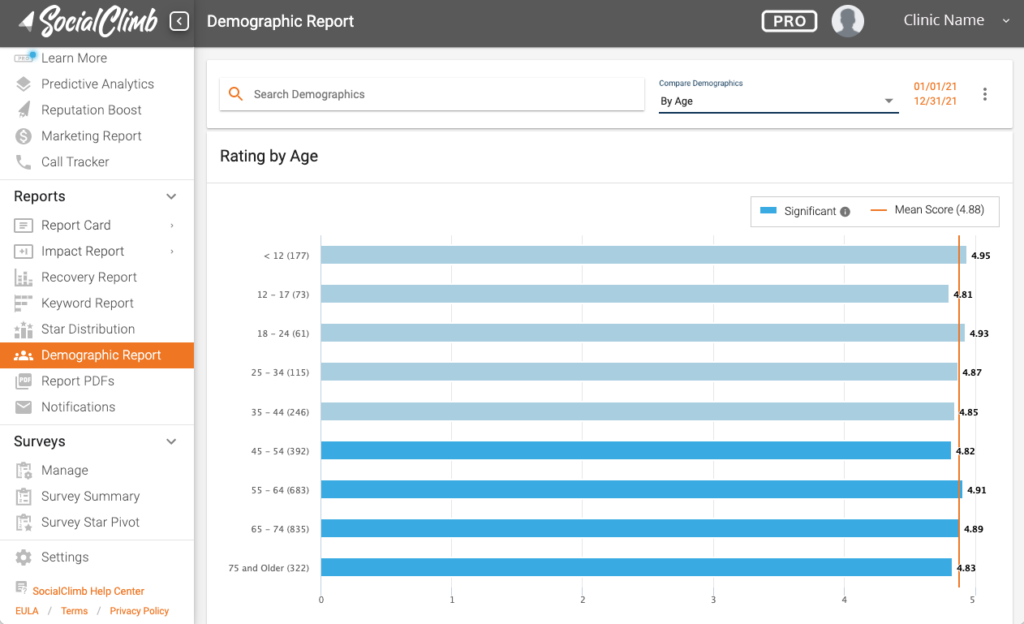
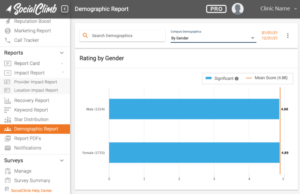 The standard view in SocialClimb’s demographic reports is a bar graph based on numbers of responses. The graph splits your chosen demographic category by subgroups to show the average response in that subgroup.
The average value from all responses shows on the right so you can see how close or far off a particular subgroup is from the overall patient experience.
See statistical significance in the bar graph. The SocialClimb demographic report builds statistical significance into its analysis. Any response from any client provides important insight into patient experience. Yet for broad initiatives, it’s helpful to know if responses show a consistent pattern, and whether that pattern is significant.
The bars in the SocialClimb report are displayed light or dark to show if there were enough responses to show an actionable pattern based on statistics.
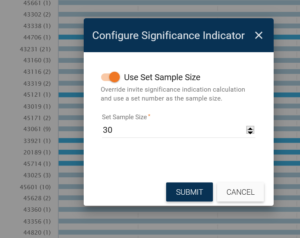 Customize the numbers used for statistical significance. One powerful feature is the ability to change the numbers used for statistical significance. You might want to change these numbers if you do not have enough clients in a particular demographic group to meet the built-in statistical standards, but you still want to track trends over time based on values that are important to you.
With this feature, you can even take a “focus group” approach. That is, you may want to take action if just 10 responses show a trend. (Or 15 or 20, etc.–you choose the number that meets your needs.)
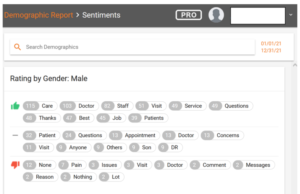
View by sentiment or expression
Sometimes seeing the words people use is more helpful than seeing numbers and statistics, because words show the human detail and emotion behind the numbers.
 This is why SocialClimb looks for important keywords and patterns of words in people’s responses. These sentiments can also be displayed by demographic group, leading to better insight and motivation to respond to people in meaningful ways.
SocialClimb highlights client expressions–by demographic–in these different ways:
- Highlights keywords that show strong positive or negative experience.
- Displays repetition counts of keywords to show patterns in client responses
- Allows you to drill down to read full individual reviews
Explore details with more smart features
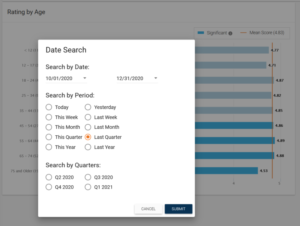
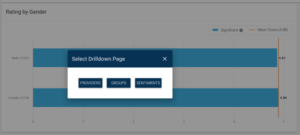 Looking at data often leads to more questions, like, “Does this happen with all of our providers, or just some?” Or, “Does this happen more at the end of the year?” Answering these questions will lead to better decisions about actions you might take.
Here are some of the features you can use to explore in depth:
- Filter demographic responses by provider, specialty group, or location.
- Choose different time periods to evaluate.
- Combine various filters.
- Click on a bar in the graph to see sentiment words represented by the numbers in that bar.
View with or without race demographic
When you evaluate equal treatment toward people of all races, you want to see demographics based on race. However, sometimes this view might get in the way of the very thing you hope to improve.
In Socialclimb’s Executive Report, you can turn on or off a display of demographic data based on race.
Measure and benchmark
 Using SocialClimb’s demographic reporting features, you can compare your results to best practices to identify areas for improvement. You can make goals, track your progress, and create reports to submit for full compensation or to meet government equity of care regulations.
Here are some of the benchmarking things you can do with SocialClimb’s demographic reports:
- Compare information by provider, specialty group, or location.
- Compare changes over time.
- Compare to other SocialClimb clients.
- Compare to data warehouses available from professional associations.
- Compare to industry standards.
- Compare to government requirements.
- Show your continuous improvement for CAHPS, MIPS, PROMs, and other standards.
SocialClimb’s demographics reporting features are just one of many powerful ways to ensure equity of care and grow your practice. Learn more about SocialClimb and request a demo.